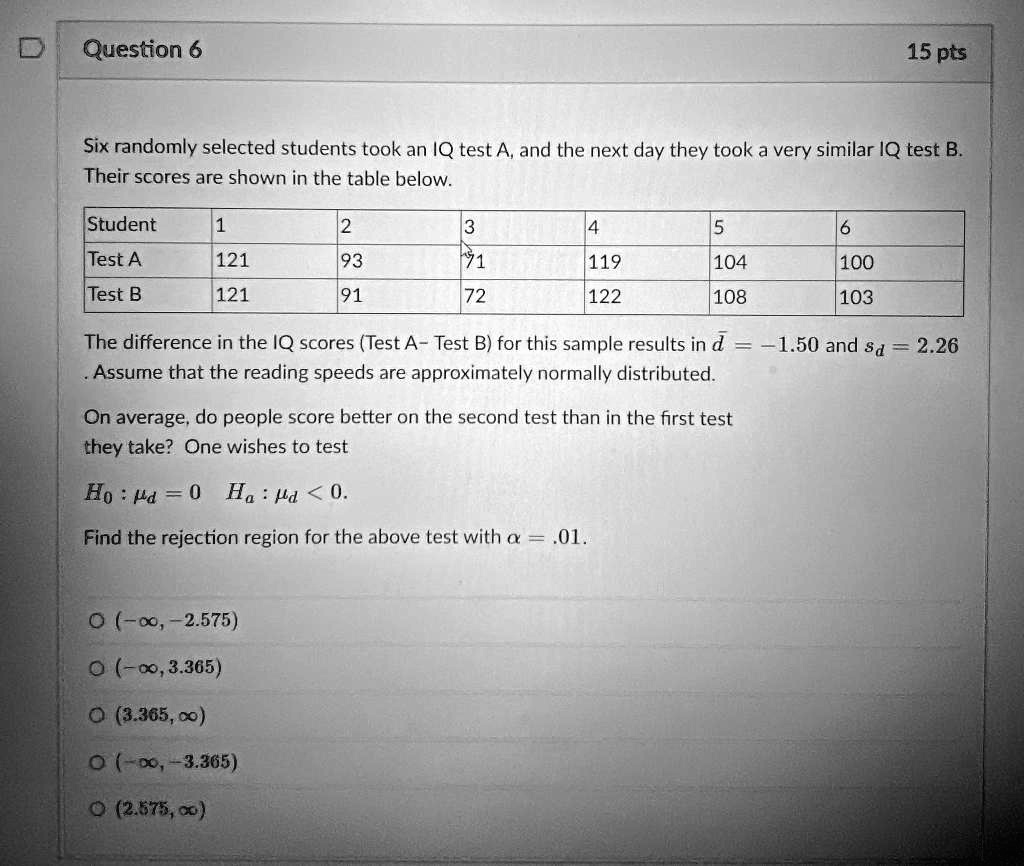
Six randomly selected students took an IQ test A,and the next day they took a very similar IQ test B_ Their scores are shown in the table below: Student Test A Test B 121 121 93 119 104 108 100 103 91 72 122 The difference in the IQ scores (Test A Test B) for this sample results in d Assume that the reading speeds are approximately normally distributed. ~1.50 and $d 2.26 On average; do people score better on the second test than in the first test ithey take? One wishes to test Ho : #d = 0 Ha : pd < 0. Find the rejection region for the above test with & 01. (-oo, 2.575) (-0,3.305) (3.365,0) 0 (-8,-3.365) (2.575,0}
The Correct Answer and Explanation is:
To determine if people score better on the second test (Test B), we conduct a left-tailed t-test for the mean difference of paired samples.
Step 1: Define Hypotheses
- Null hypothesis: H0:μd=0H_0: \mu_d = 0
- Alternative hypothesis: Ha:μd<0H_a: \mu_d < 0
This means we suspect that the average difference between Test A and Test B is negative, implying higher scores on the second test.
Step 2: Given Data
- Sample mean difference: dˉ=−1.50\bar{d} = -1.50
- Standard deviation of differences: sd=2.26s_d = 2.26
- Sample size: n=6n = 6
- Significance level: α=0.01\alpha = 0.01
Step 3: Calculate Test Statistic
We use the formula for the t-statistic:
t=dˉ−μ0sd/n=−1.50−02.26/6≈−1.500.9229≈−1.625t = \frac{\bar{d} – \mu_0}{s_d / \sqrt{n}} = \frac{-1.50 – 0}{2.26 / \sqrt{6}} \approx \frac{-1.50}{0.9229} \approx -1.625
Step 4: Determine the Rejection Region
Since this is a left-tailed test with α=0.01\alpha = 0.01 and degrees of freedom df=5df = 5, we use the t-table to find the critical value:
t0.01,5=−3.365t_{0.01, 5} = -3.365
So, the rejection region is: (−∞,−3.365)(-\infty, -3.365)
Step 5: Conclusion
The calculated t-value of -1.625 is not in the rejection region. Therefore, we fail to reject the null hypothesis. There is insufficient evidence to conclude that people score better on the second test than on the first.
Correct answer: (-∞, -3.365)