: X2 X6 2 14 373444 36 18 0 A 2 in row 1, column 2 B. 4 in row 3, column C in row 2, column 5 0 D. 3 in row 2, column 3
The Correct Answer and Explanation is:
is a crucial part of the simplex method, which is used to solve linear programming problems. The goal is to identify an element in the tableau that will help us move to a better solution in the next iteration. This involves two main steps: identifying the pivot column and then the pivot row.
Step 1: Identify the Pivot Column
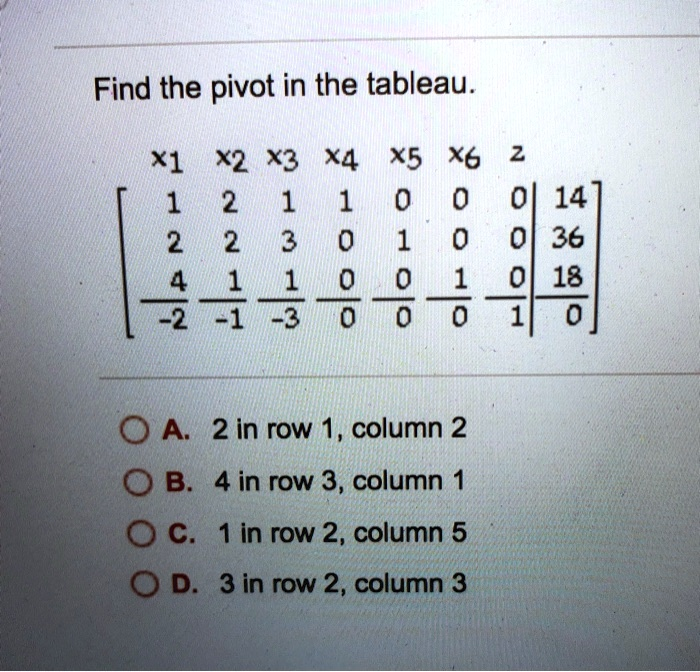
First, we look at the last row of the tableau, which is often called the objective function row or the indicator row. The values in this row, excluding the last two entries (in the ‘z’ and constant columns), are -2, -1, -3, 0, 0, and 0.
To find the pivot column for a maximization problem, we select the column corresponding to the most negative indicator in this bottom row. Comparing the negative values, we see that -3 is the most negative number. This value is in the third column, which corresponds to the variable x3. Therefore, the third column is our pivot column.
Step 2: Identify the Pivot Row
Next, we determine the pivot row by calculating test ratios. We do this for each of the other rows (rows 1, 2, and 3). The test ratio is calculated by dividing the value in the right-hand side (the last column) by the corresponding positive value in the pivot column.
- Row 1: The value in the pivot column (column 3) is 1.The correct answer is D. 3 in row 2, column 3.
Here is a step-by-step explanation of how to find the pivot element in the given simplex tableau:
Step 1: Identify the Pivot Column
The first step is to determine the pivot column. This is done by looking at the last row of the tableau, which represents the objective function or indicator row. We need to find the most negative number in this row, excluding the final value in the rightmost column.
The last row is: [-2, -1, -3, 0, 0, 0, 1 | 0]
The indicator values are -2, -1, and -3. The most negative value is -3. This value is located in the third column (the x3 column), making column 3 the pivot column.
Step 2: Identify the Pivot Row
Next, we identify the pivot row. To do this, we calculate a test ratio for each of the other rows (the constraint rows). The ratio is found by dividing the value in the rightmost column (the constants) by the corresponding value in the pivot column. We only consider rows where the value in the pivot column is positive.
- Row 1: The constant is 14 and the value in the pivot column is 1.
Test Ratio = 14 / 1 = 14 - Row 2: The constant is 36 and the value in the pivot column is 3.
Test Ratio = 36 / 3 = 12 - Row 3: The constant is 18 and the value in the pivot column is 1.
Test Ratio The value in the right-hand side is 14.
Test Ratio = 14 / 1 = 14 - Row 2: The value in the pivot column is 3. The value in the right-hand side is 36.
Test Ratio = 36 / 3 = 12 - Row 3: The value in the pivot column is 1. The value in the right-hand side is 18.
Test Ratio = 18 / 1 = 18
The pivot row is the one with the smallest non-negative test ratio. Comparing the ratios (14, 12, and 18), the smallest value is 12. This corresponds to the second row.
Conclusion: Identify the Pivot Element
The pivot element is the entry at the intersection of the pivot column and the pivot row. In this case, it is the element in column 3 and row 2, which is the number 3. This matches option D. = 18 / 1 = 18
The pivot row is the row with the smallest non-negative test ratio. Comparing the ratios (14, 12, and 18), the smallest is 12, which corresponds to row 2.
Step 3: Identify the Pivot Element
number at the intersection of the pivot column and the pivot row. Based on our calculations, the pivot is in column 3 and row 2. The number at this position in the tableau is 3.
Therefore, the pivot is 3, located in row 2, column 3. This matches option D.thumb_upthumb_down