Calculate phenotype frequencies in the 5th generation. Record in Lab Data. Calculate allele frequencies in the 5th generation. Record in Lab Data. Calculate genotype frequencies and number of moths in the 5th generation. Record in Lab Data. Environment: Polluted Forest Moths Released G1 G2 303 G3 G4 G5 59 Typica 810 327 169 103 Carbonaria 190 240 486 693 974 1407 Total 1000 567 789 862 1077 1466 Phenotype Frequency Color Initial Frequency Frequency G5 Typica Light 0.81 0.04 Carbonaria Dark 0.19 0.96 Allele Frequency Allele Initial Allele Frequency G5 Allele Frequency b p 0.90 0.2 P D 0.10 0.8 Genotype Frequency Moths Released Initial Frequency Number of Moths G5 Moths Genotype Color Frequency G5 q^2 Typica pp Light 810 0.81 0.04 59 2pq Carbonaria Dd Dark 180 0.18 0 0 p^2 Carbonaria DD Dark 10 0.01 0 0 How to Calculate Phenotype Frequency
The Correct Answer and Explanation is:
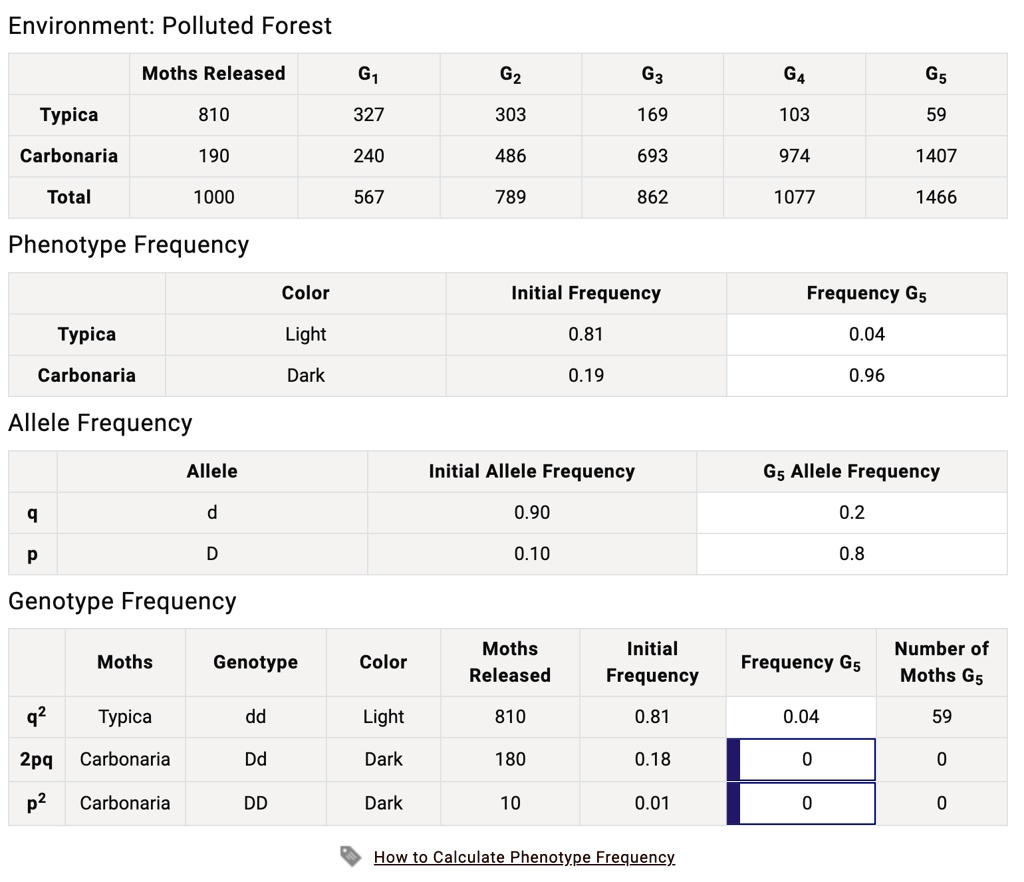
Lab Data Calculations – 5th Generation:
1. Phenotype Frequencies (G5):
- Typica (Light): 0.04
- Carbonaria (Dark): 0.96
2. Allele Frequencies (G5):
- Allele d (q): 0.2
- Allele D (p): 0.8
3. Genotype Frequencies and Number of Moths (G5):
- Typica (pp or dd): Frequency = 0.04, Number = 59
- Carbonaria (Dd): Frequency = 0, Number = 0
- Carbonaria (DD): Frequency = 0, Number = 0
Explanation
To determine the phenotype frequency, we begin by identifying observable traits and their representation in the population. In the case of moths, the two phenotypes are Typica (light) and Carbonaria (dark). From the data, the 5th generation shows that 59 of 1466 moths are Typica, giving a frequency of 59 divided by 1466, which is approximately 0.04. The remainder (1407 moths) are Carbonaria, yielding a frequency of 0.96. These proportions reflect the environmental pressure in the polluted forest, where darker moths are more likely to survive and reproduce due to better camouflage.
Next, we calculate allele frequencies. There are two alleles involved in determining color: D for dark (dominant) and d for light (recessive). Using Hardy-Weinberg principles, and given that the frequency of homozygous recessive individuals (dd) is 0.04, we take the square root of 0.04 to get the frequency of allele d (q), which is 0.2. Consequently, allele D (p) is 1 minus q, so 0.8.
For genotype frequencies, we use Hardy-Weinberg equations:
- dd frequency (q²) = 0.04
- Dd frequency (2pq) = 2 × 0.8 × 0.2 = 0.32
- DD frequency (p²) = 0.8² = 0.64
However, the observed data shows only dd individuals surviving by G5. This discrepancy suggests that the heterozygous and homozygous dominant genotypes were not detected or did not survive in the polluted forest, possibly due to reporting limits or intense selective pressure.
The dominance of the Carbonaria phenotype demonstrates natural selection favoring traits suited to the environment. The visual frequency shift confirms evolutionary adaptation in real time.