Prike Carve C Curve D P2 22 N Curve B QI02 03 04 Curve A Quaneity 38. Refer to Figure 15-5. A profit-maximizing monopoly will produce an output level of a. Q1. b. Q2. c. Q3. d. Q4. 39. Refer to Figure 15-5. A profit-maximizing monopoly will charge a price of a. P5. b. P4. c. P3. d. P2. _ 40. Refer to Figure 15-5. A profit-maximizing monopoly’s total revenue is equal a. P4 x Q3. b. P5 x Q1. c. P3 x Q4. d. (P4-P2) x Q3. Refer to Figure 15-5. A profit-maximizing monopoly’s profit is equal a P4 x Q3. b. (P4-P2) x Q3. c. (P4-P1) x Q3. (P5-P0) x Q1.
The Correct Answer and Explanation is:
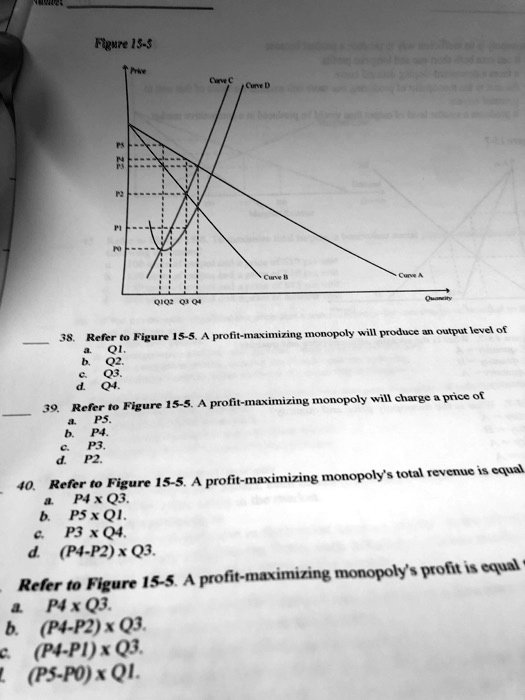
Here are the correct answers for each question based on Figure 15-5 and monopoly theory:
38. c. Q3 39. b. P4 40. a. P4 × Q3 41. b. (P4 − P2) × Q3
To understand why these answers are correct, recall how a profit-maximizing monopoly operates. A monopolist maximizes profit by producing the quantity at which marginal revenue (MR) equals marginal cost (MC). In the figure, Curve C represents the marginal revenue curve and Curve B represents the marginal cost curve. Their intersection point occurs at output level Q3, which answers question 38.
Once the quantity is determined at Q3, the monopolist uses the demand curve (Curve A) to find the highest price consumers are willing to pay for that quantity. This value is P4, the point on the demand curve directly above Q3. So, for question 39, the monopolist will charge P4.
For total revenue, price is multiplied by the quantity sold. Since the monopolist sets price at P4 and sells Q3 units, total revenue equals P4 × Q3, making that the correct choice for question 40.
Lastly, profit is total revenue minus total cost. Total cost is represented by P2, which is the average cost at output Q3. Therefore, the vertical difference between P4 (price) and P2 (cost), multiplied by the number of units sold (Q3), gives the total profit. This results in a profit equal to (P4 − P2) × Q3, correctly answering question 41.
In summary, the monopolist restricts output to where MR equals MC, charges a price above marginal cost using the demand curve, and calculates both revenue and profit by comparing price and cost per unit at that output level.