Data Table: Adjustments in Blood Pressure After exercise Systolic/Diastolic BP Test Resting Systolic/Diastolic BP Body position change Systolic/Diastolic BP Subject 1: Test #1 123/71 131/75 121/68 118/72 148/83 Test #2 128/68 151/85 Test #3 115/69 138/73 Average Subject 2: Test #1 136/76 131/70 133/72 129/75 156/86 149/72 Test #2 130/68 127/69 Test #3 157/81 Average How does Subject #1’s blood pressure compare with that of Subject #2 at rest? How do they compare after exercise? What can you conclude are the benefits of physical fitness
The Correct Answer and Explanation is:
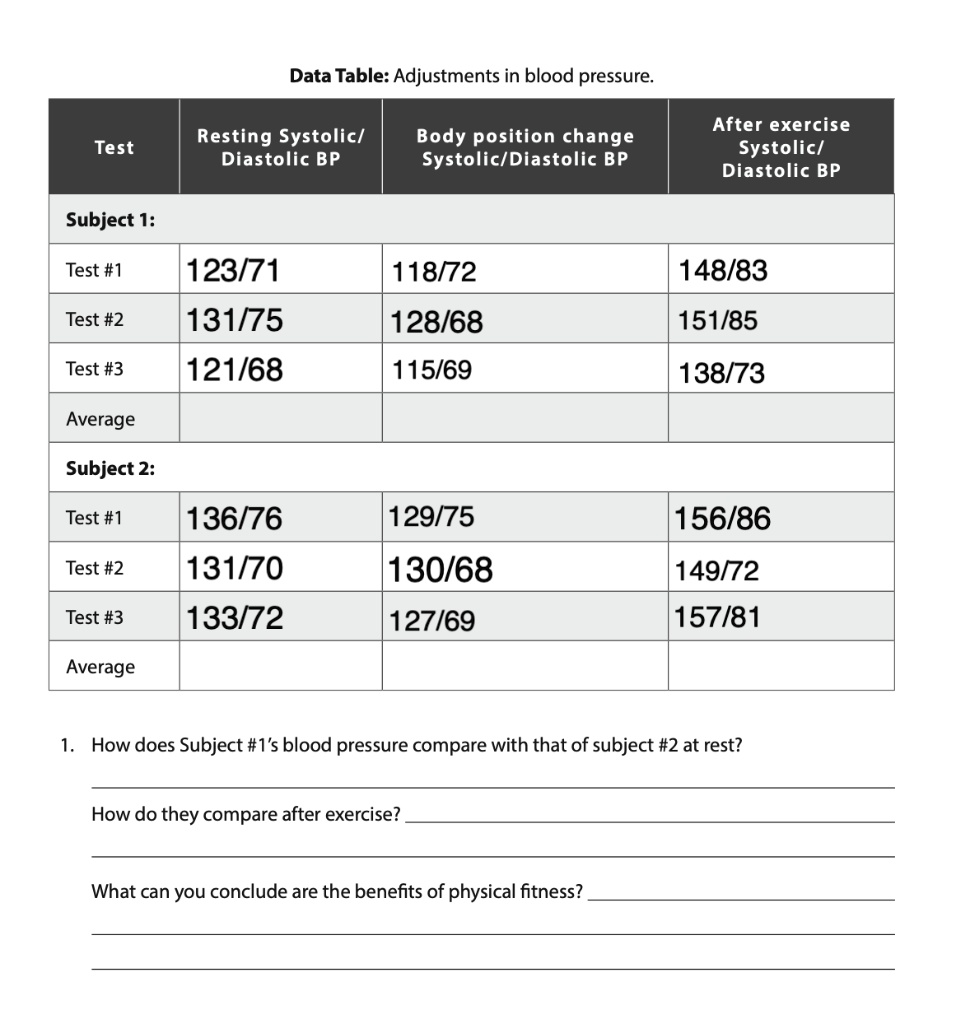
1. How does Subject #1’s blood pressure compare with that of subject #2 at rest?
Subject #1 has a lower resting blood pressure than Subject #2. The average resting blood pressure for Subject #1 is 125/71 mmHg, while Subject #2’s average is 133/73 mmHg.
How do they compare after exercise?
After exercise, Subject #1’s systolic blood pressure is also lower than Subject #2’s. The average post-exercise blood pressure for Subject #1 is 146/80 mmHg, whereas Subject #2’s average is 154/80 mmHg. Their diastolic pressures are nearly identical.
What can you conclude are the benefits of physical fitness?
The data suggests that physical fitness contributes to a lower resting blood pressure and a more efficient cardiovascular response to physical stress. A person who is more physically fit, like Subject #1 appears to be, can maintain a healthier, lower blood pressure both at rest and during recovery from exertion.
Explanation
The provided data table offers a clear insight into the cardiovascular health of two individuals, likely with different levels of physical fitness. To accurately compare them, we first calculate their average blood pressures. Subject #1’s average resting blood pressure is 125/71 mmHg, which falls within the normal, healthy range. In contrast, Subject #2’s average resting blood pressure is 133/73 mmHg. This reading is higher, approaching the category of elevated blood pressure or stage 1 hypertension, and suggests that Subject #2’s cardiovascular system is under more strain even at rest. A lower resting blood pressure is a primary indicator of good cardiovascular fitness because it means the heart does not have to work as hard to circulate blood.
This trend continues when observing the post-exercise data. It is a normal physiological response for blood pressure to rise during exercise to meet the body’s increased demand for oxygen. However, the data shows that Subject #1’s cardiovascular system manages this stress more efficiently. After exercise, Subject #1’s average systolic pressure rose to 146 mmHg, while Subject #2’s rose to a higher 154 mmHg. This indicates that Subject #1’s heart and blood vessels are better conditioned to handle physical exertion. While their diastolic pressures were similar after exercise, the consistently lower systolic pressure in Subject #1 at rest and after activity points to better overall fitness.
From this comparison, we can conclude that the benefits of physical fitness are significant for cardiovascular health. Regular physical activity strengthens the heart muscle, improves the elasticity of blood vessels, and helps the body manage stress more effectively. The data demonstrates that a physically fit individual, represented by Subject #1, maintains a healthier blood pressure profile. This reduces the daily workload on the heart and lowers the long term risk of developing serious health conditions such as chronic hypertension, heart disease, and stroke