1 . Profit maximization and loss minimization
The Correct Answer and Explanation is:
Here is the solution to the problem, followed by a detailed explanation.
Correct Answer
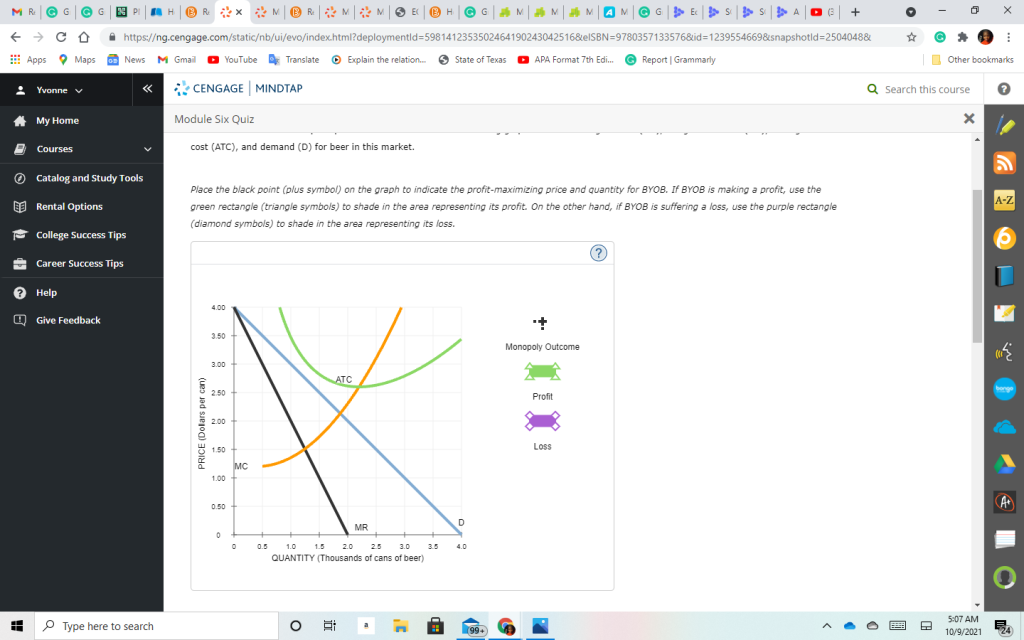
- Monopoly Outcome: The black point (plus symbol) should be placed at the intersection of a quantity of 1.5 thousand cans and a price of $3.00 per can.
- Profit or Loss: The firm is making a profit. The green rectangle (Profit) should be used to shade the area defined by the corners at the price of $3.00 and the average total cost of $2.25, from a quantity of 0 to 1.5.
Here is an image showing the correct placement:
Explanation of Profit Maximization and Loss Minimization
A firm operating as a monopoly determines its optimal output and price by following the universal rule of profit maximization. This rule dictates that a firm should produce at the quantity where its marginal revenue (MR) equals its marginal cost (MC). This MR=MC intersection represents the point where the revenue gained from selling one additional unit is exactly equal to the cost of producing that unit. Producing beyond this point would mean each additional unit costs more to make than it generates in revenue, thus decreasing total profit.
To apply this principle to the provided graph, we first locate the intersection of the marginal revenue curve (MR, the black line) and the marginal cost curve (MC, the orange line). This occurs at a quantity of 1.5 thousand cans of beer. This is the profit-maximizing quantity.
Once the quantity is established, a monopolist finds the highest price consumers are willing to pay for that specific quantity. To do this, we move vertically from the quantity of 1.5 up to the demand curve (D, the blue line). From that point on the demand curve, we look across to the price axis to find the corresponding price, which is $3.00 per can. Therefore, the monopoly outcome is a price of $3.00 and a quantity of 1.5 thousand cans.
To determine if the firm is making a profit or a loss, we compare the price to the average total cost (ATC) at the profit-maximizing quantity. At a quantity of 1.5, the ATC curve (the green line) shows an average cost of
2.25percan.Sincetheprice(2.25percan.Sincetheprice(3.00) is greater than the average total cost ($2.25), the firm is earning an economic profit. The profit per unit is
0.75(0.75(3.00 minus $2.25). The total profit is this per-unit profit multiplied by the quantity sold, represented by the green shaded rectangular area. If the ATC had been above the price, the firm would still produce where MR=MC to minimize its losses.thumb_upthumb_down