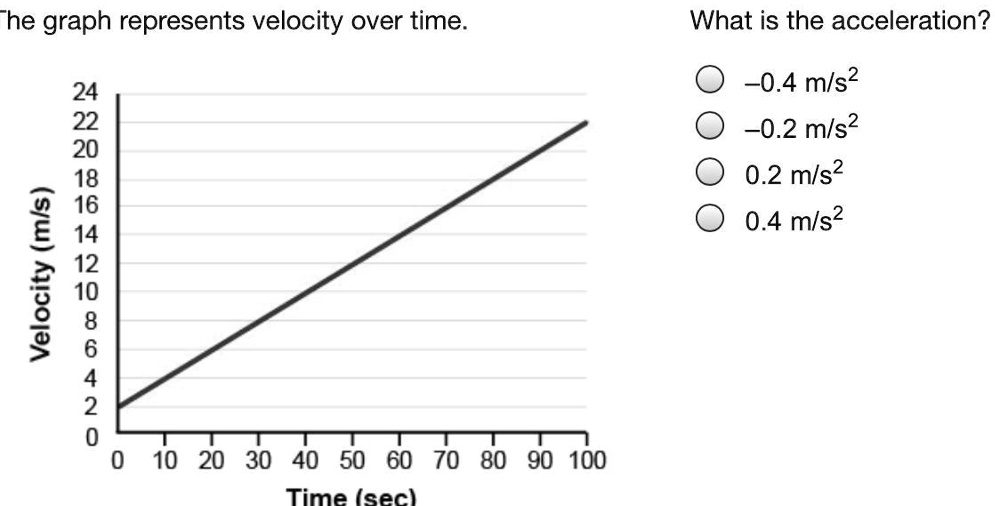
The graph represents velocity over time. What is the acceleration? -0.4 m/s² -0.2 m/s² 0.2 m/s² 0.4 m/s²
The Correct Answer and Explanation is:
The correct answer is 0.2 m/s².
To find acceleration from a velocity versus time graph, you analyze the slope of the graph. Acceleration is defined as the rate of change of velocity with respect to time. Mathematically, it is given by the formula:
a=ΔvΔta = \frac{\Delta v}{\Delta t}
where Δv\Delta v is the change in velocity, and Δt\Delta t is the change in time.
According to the graph, the velocity starts at 0 m/s and reaches 20 m/s at 100 seconds. That gives:
Δv=20 m/s−0 m/s=20 m/s\Delta v = 20 \, \text{m/s} – 0 \, \text{m/s} = 20 \, \text{m/s}
Δt=100 s−0 s=100 s\Delta t = 100 \, \text{s} – 0 \, \text{s} = 100 \, \text{s}
Substituting into the formula:
a=20 m/s100 s=0.2 m/s2a = \frac{20 \, \text{m/s}}{100 \, \text{s}} = 0.2 \, \text{m/s}^2
This value is positive, which indicates the object is accelerating. Since the velocity-time graph is a straight line, the acceleration is constant throughout the entire time interval. A sloped line on a velocity-time graph always represents uniform acceleration, and the steeper the slope, the greater the acceleration. In this case, the moderate, steady rise from 0 to 20 m/s over 100 seconds results in a gentle, consistent acceleration.
Among the given choices, 0.2 m/s² matches the calculated value. The negative values can be ruled out because the graph shows velocity increasing rather than decreasing. Likewise, 0.4 m/s² overstates the rate of change.
This analysis highlights how closely interpreting a graph connects to understanding motion. Graphs like these are visual tools that encapsulate physical laws in a simple, elegant form.