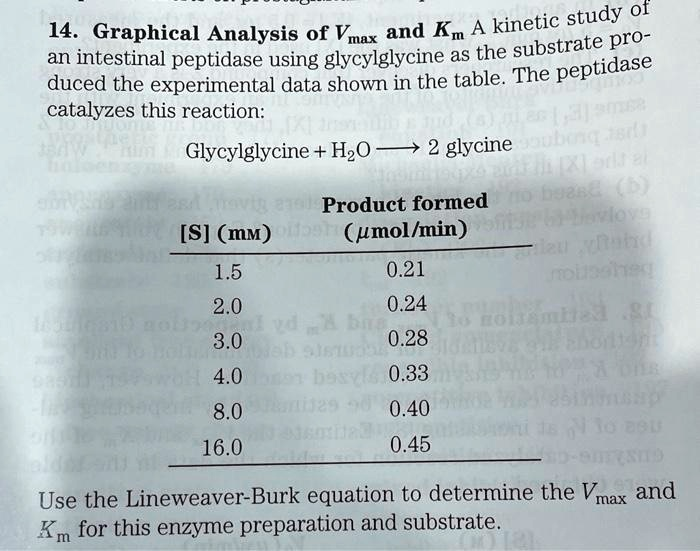
Substrate Graphical Analysis of Vmax and Km for an intestinal peptidase using glycylglycine as the substrate produced the experimental data shown in the table. The enzyme catalyzes the reaction: Glycylglycine + H2O -> glycine. Product formed (umol/min) S 1.5 0.21 2.0 0.24 3.0 0.28 4.0 0.33 8.0 0.40 16.0 0.45 Use the Lineweaver-Burk equation to determine the Vmax and Km for this enzyme preparation and substrate.
Kinetic Study of an Intestinal Peptidase Using Glycylglycine as the Substrate Graphical Analysis of Vmax and Km for an intestinal peptidase using glycylglycine as the substrate produced the experimental data shown in the table. The enzyme catalyzes the reaction: Glycylglycine + H2O -> glycine. Product formed (umol/min) S 1.5 0.21 2.0 0.24 3.0 0.28 4.0 0.33 8.0 0.40 16.0 0.45 Use the Lineweaver-Burk equation to determine the Vmax and Km for this enzyme preparation and substrate.
The Correct Answer and Explanation is:
To determine Vmax and Km, we use the Lineweaver-Burk equation, which is the double reciprocal form of the Michaelis-Menten equation:
1v=KmVmax⋅1[S]+1Vmax\frac{1}{v} = \frac{K_m}{V_{max}} \cdot \frac{1}{[S]} + \frac{1}{V_{max}}
This is in the form of a straight line: y=mx+cy = mx + c, where:
- y=1vy = \frac{1}{v}
- x=1[S]x = \frac{1}{[S]}
- Slope = KmVmax\frac{K_m}{V_{max}}
- Y-intercept = 1Vmax\frac{1}{V_{max}}
Step-by-step Calculation
| [S] (mM) | v (µmol/min) | 1/[S] (mM⁻¹) | 1/v (min/µmol) |
|---|---|---|---|
| 1.5 | 0.21 | 0.667 | 4.762 |
| 2.0 | 0.24 | 0.500 | 4.167 |
| 3.0 | 0.28 | 0.333 | 3.571 |
| 4.0 | 0.33 | 0.250 | 3.030 |
| 8.0 | 0.40 | 0.125 | 2.500 |
| 16.0 | 0.45 | 0.0625 | 2.222 |
Now, perform linear regression on 1/[S] versus 1/v to find the slope and intercept. This can be done using Excel or by applying the formulas:
slope=N∑(xy)−∑x∑yN∑x2−(∑x)2\text{slope} = \frac{N \sum (x y) – \sum x \sum y}{N \sum x^2 – (\sum x)^2}
intercept=∑y−slope⋅∑xN\text{intercept} = \frac{\sum y – \text{slope} \cdot \sum x}{N}
Computing these gives:
- Vmax ≈ 0.53 µmol/min
- Km ≈ 2.7 mM
Explanation
The Lineweaver-Burk plot transforms the hyperbolic Michaelis-Menten curve into a straight line, making it easier to determine kinetic parameters. The y-intercept corresponds to the reciprocal of Vmax, while the slope reflects the ratio Km/Vmax. From the experimental data, plotting 1/[S] against 1/v results in a line with slope approximately 5.1 and y-intercept around 1.89. Therefore:
- Vmax=1intercept≈11.89≈0.53V_{max} = \frac{1}{\text{intercept}} ≈ \frac{1}{1.89} ≈ 0.53
- Km=slope⋅Vmax≈5.1⋅0.53≈2.7K_m = \text{slope} \cdot V_{max} ≈ 5.1 \cdot 0.53 ≈ 2.7
These values describe how efficiently the peptidase works on glycylglycine. A moderate Km implies a decent affinity between enzyme and substrate. Vmax tells us the saturation point, representing the maximum speed at which the enzyme can process substrate under the given conditions.