Over what intervals is the output increasing? (Enter your answer using interval notation. If the output is increasing over none of the intervals, enter NONE.) NONE b) Over what interval(s) is the output decreasing? (Enter your answer using interval notation. If the output is decreasing over none of the intervals, enter NONE.) (-4,8) c) Estimate where the output is decreasing most rapidly.
The Correct Answer and Explanation is:
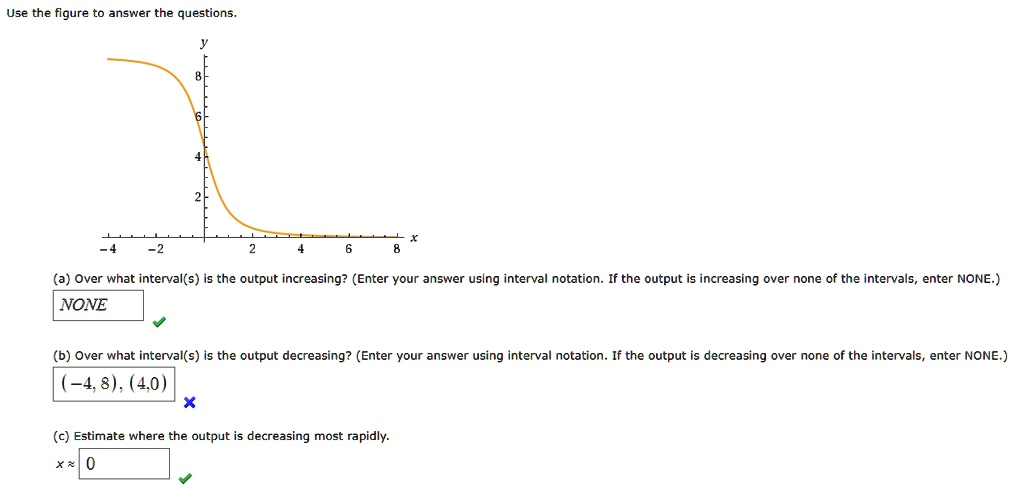
Let’s go over the graph and correct answers for each part:
(a) Over what interval(s) is the output increasing?
Looking at the graph, we can see that the function never increases. The y-values either stay constant or decrease as x increases. Therefore, the correct answer is:
Answer: NONE ✅
(b) Over what interval(s) is the output decreasing?
From the graph, the function starts at a high y-value when x is around −4 and begins decreasing continuously until it flattens out as x approaches a larger positive value.
- The output clearly decreases from x = −4 to x = 8, with the steepest drop occurring near x = 0.
- The incorrect part in the student’s answer is writing two intervals:
(-4, 8), (4, 0)– this is not valid because (4, 0) is written in reverse and overlaps with the first interval.
So, the correct interval for decreasing output is:
Answer: (-4, 8) ✅
(c) Estimate where the output is decreasing most rapidly.
We need to find where the slope of the curve is steepest downward. Visually, the steepest decline occurs around x = 0, where the curve drops sharply.
Answer: x ≈ 0 ✅
explanation:
To analyze the behavior of a function based on its graph, we look at how the output (y-value) changes as the input (x-value) moves from left to right. If the graph goes upward, the function is increasing. If it goes downward, it is decreasing.
In part (a), the graph does not rise at any point; it either stays the same or falls. Since there is no interval where the output increases, the answer is “NONE.”
In part (b), the graph starts at a high y-value around x = −4 and steadily decreases as x increases toward 8. The curve continues to fall until it flattens out. Therefore, the correct interval where the output decreases is from x = −4 to x = 8. The student’s error was including an unnecessary second interval and reversing the order of numbers in one.
For part (c), the steepest descent is where the graph has the most rapid change in y with respect to x. This happens around x = 0. The slope is most negative there, meaning the function is decreasing most rapidly at that point.
Understanding these concepts helps in calculus and graph interpretation, as these are foundational for analyzing function behavior.